Flip a matrix to be passed to image.
flip4image.RdFlip a matrix such that it will appear `as is' when plotted by
image.
Note that image shows the rows of the matrix
on the x axis and the columns of the matrix on the y axis (with
column 1 at the bottom), such that the matrix gets displayed rotated
90 degree clockwise. `flip4image' therefore rotates the matrix 90 degree
coutner-clockwise, such that the rotation made by
image results in the desired form of the matrix.
flip4image(x)
Arguments
| x | a matrix |
|---|
Value
The matrix x prepared to be displyed by image.
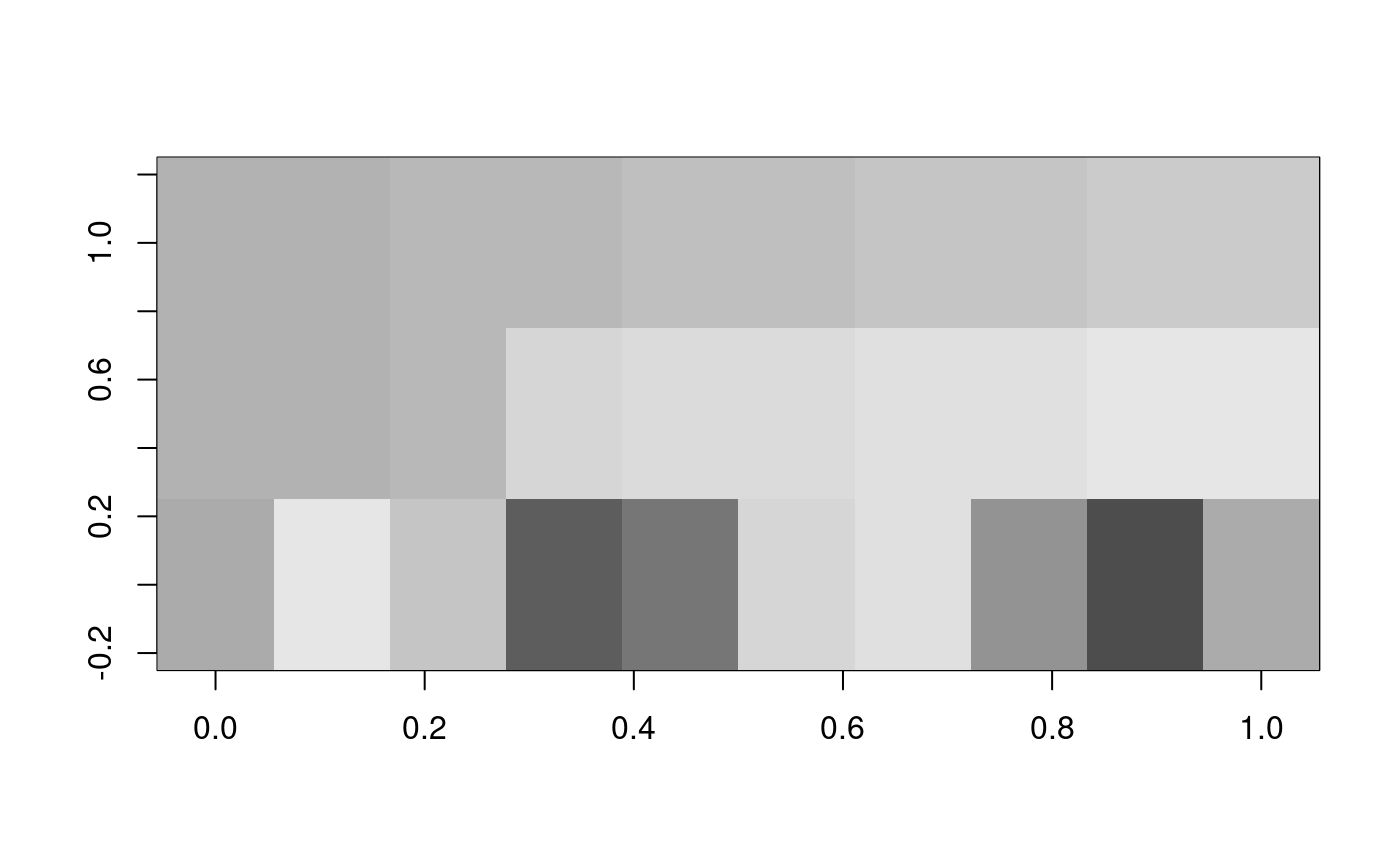
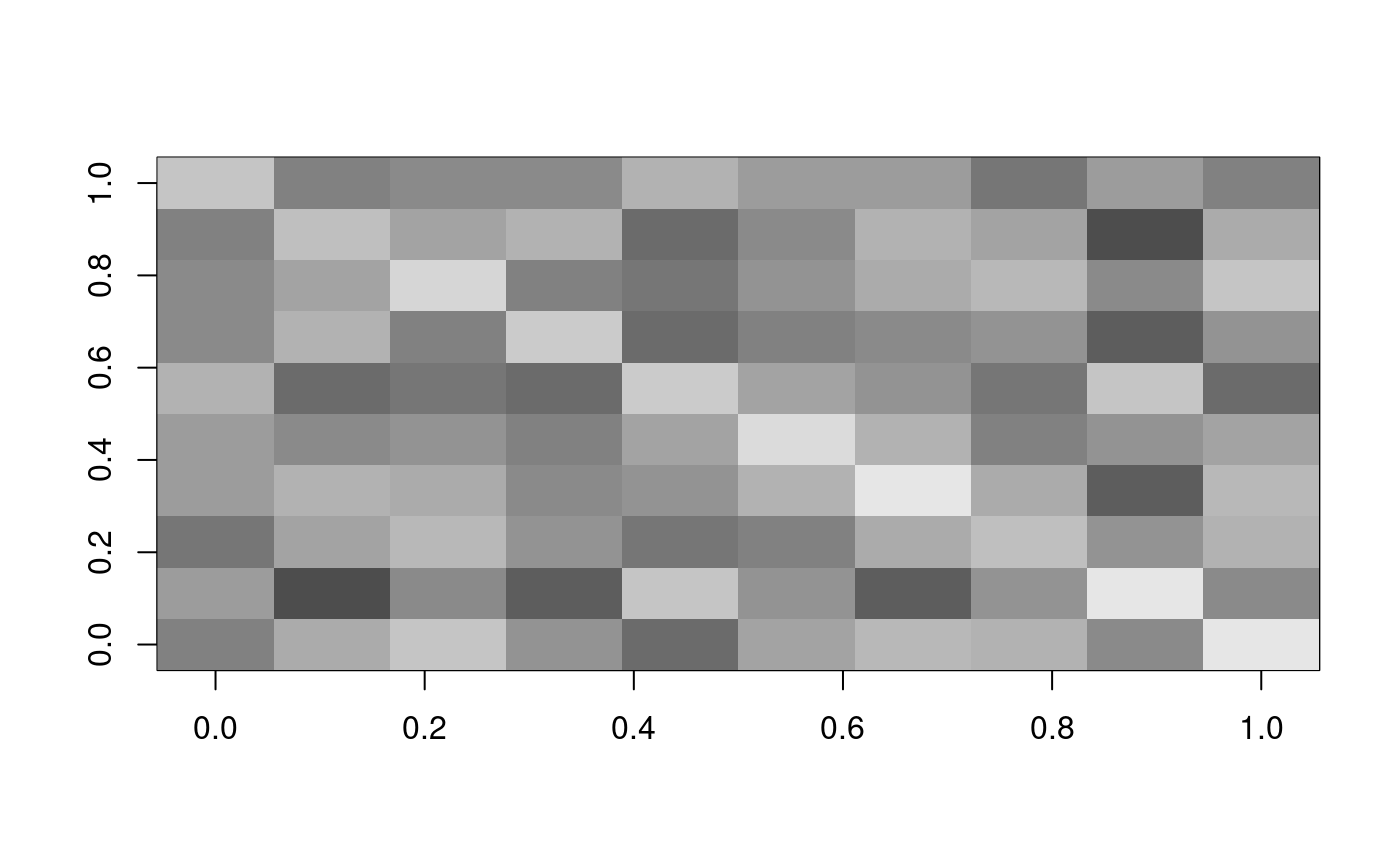
Examples
#> [,1] [,2] [,3] [,4] [,5] [,6] [,7] [,8] #> [1,] 1 2.00000 3.000000 4.00000 5.00000 6.00000 7.00000 8.000000 #> [2,] 1 2.00000 3.000000 14.00000 15.00000 16.00000 17.00000 18.000000 #> [3,] 0 19.69616 6.840403 -17.32051 -12.85575 12.85575 17.32051 -6.840403 #> [,9] [,10] #> [1,] 9.00000 1.000000e+01 #> [2,] 19.00000 2.000000e+01 #> [3,] -19.69616 -9.797174e-15# plot a covariance matrix m<-cov(matrix(rnorm(100),10,10)) image(flip4image(m),col=gray.colors(20))# plot the Cholsky decomposition of the a covariance matrix (an upper triangular matrix) image(flip4image(chol(cov(m))),col=gray.colors(20))