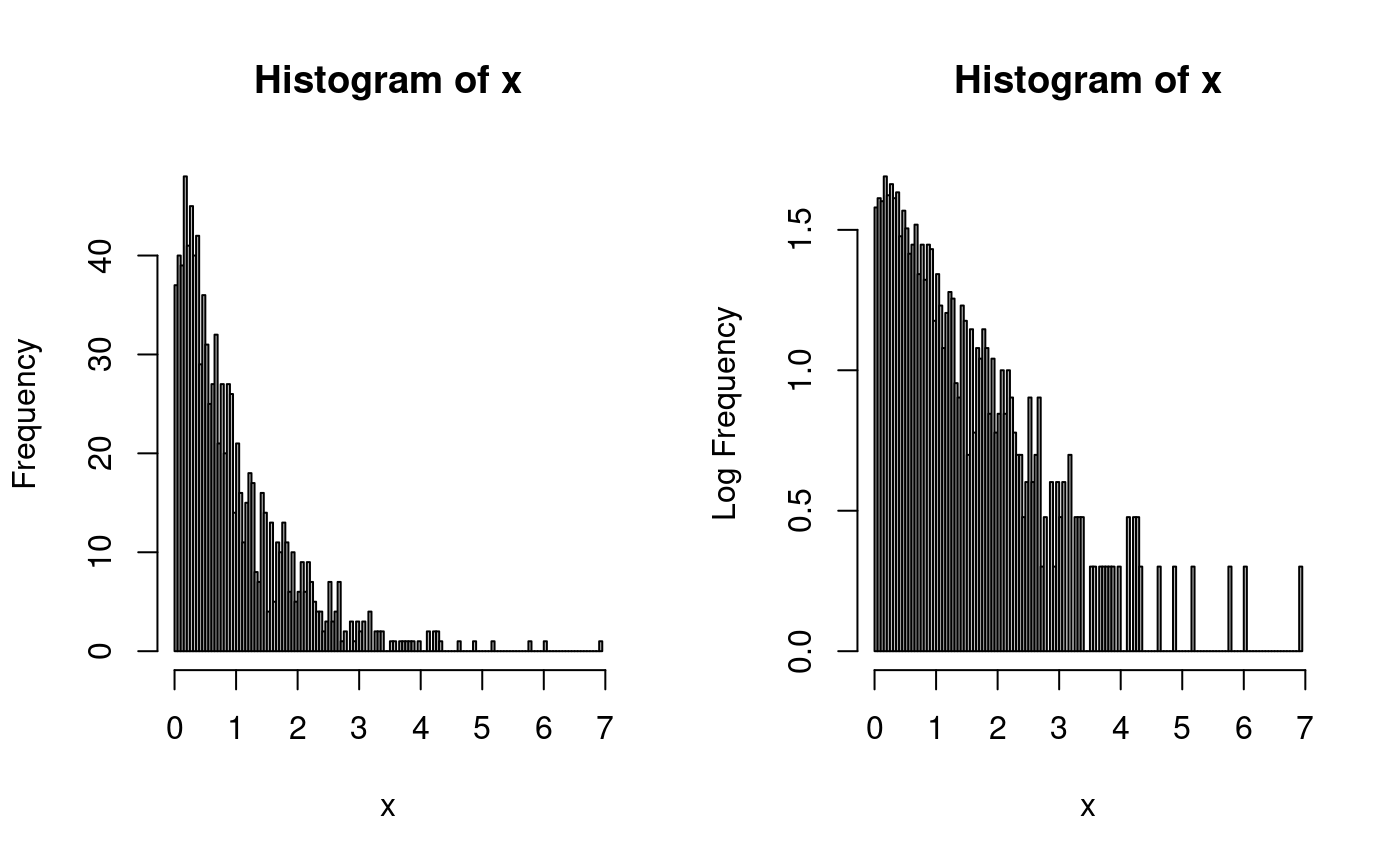
Histogram with log counts and defaults.
histld.Rdhistld plots a histogram having the counts logged and
passing some default values to hist.
histld(x, breaks = 100, col = "gray", main = NULL, xlab = NULL,
    plot = TRUE, ...)
Arguments
| x | a vector of values for which the histogram is desired |
|---|---|
| breaks | histogram breaks, see |
| col | a color to fill the bars, defaults to gray, see |
| main | |
| xlab | |
| plot | |
| ... | other parameters to |
Value
an object of class histogram, see hist
Examples
par(opar)