Vertically aligned histograms.
histv.Rdhistv creates one or more vertically aligned histograms,
rendered by hist. This is useful for visual
comparison of several numeric vectors.
histv(..., setup = TRUE, setupDev = NULL, ylimFixed = FALSE,
    col = NULL, border = NULL, main = NULL, xlab = NULL, callback = NULL,
    debug = FALSE)
Arguments
| ... | one or more numeric vectors to compare |
|---|---|
| setup | if TRUE, graphic device will be set up to hold enough subfigures. If FALSE, no setup will be performed. |
| setupDev | deprecated, use |
| ylimFixed | if TRUE, ylim of all histograms will be the same. Useful to visually assess the proportions of the individual samples. |
| col | colour(s) to be used to fill the bars. The default of
|
| border | the color(s) of the border around the bars. The default is to use the standard foreground color. If a vector is suplied, it will be used to define the border of individual histograms, recycled if necessary. |
| main | the title(s) of the individual histograms. If a character vector is suplied, it will be used to define the title of individual histograms, recycled if necessary. |
| xlab | xlab(s) of the individual histograms. If a character vector is suplied, it will be used to define the title of individual histograms, recycled if necessary. |
| callback | callback function to be called after each
individual histogram gets plotted, receiving two arguments: the
list of arguments passed to |
| debug | if TRUE, debugs will be printed. If numeric of value greater than 1, verbose debugs will be produced. |
Value
a list of objects of class 'histograms' (see
hist). The elements correspond to individual
histograms depicting the individual numeric vectors.
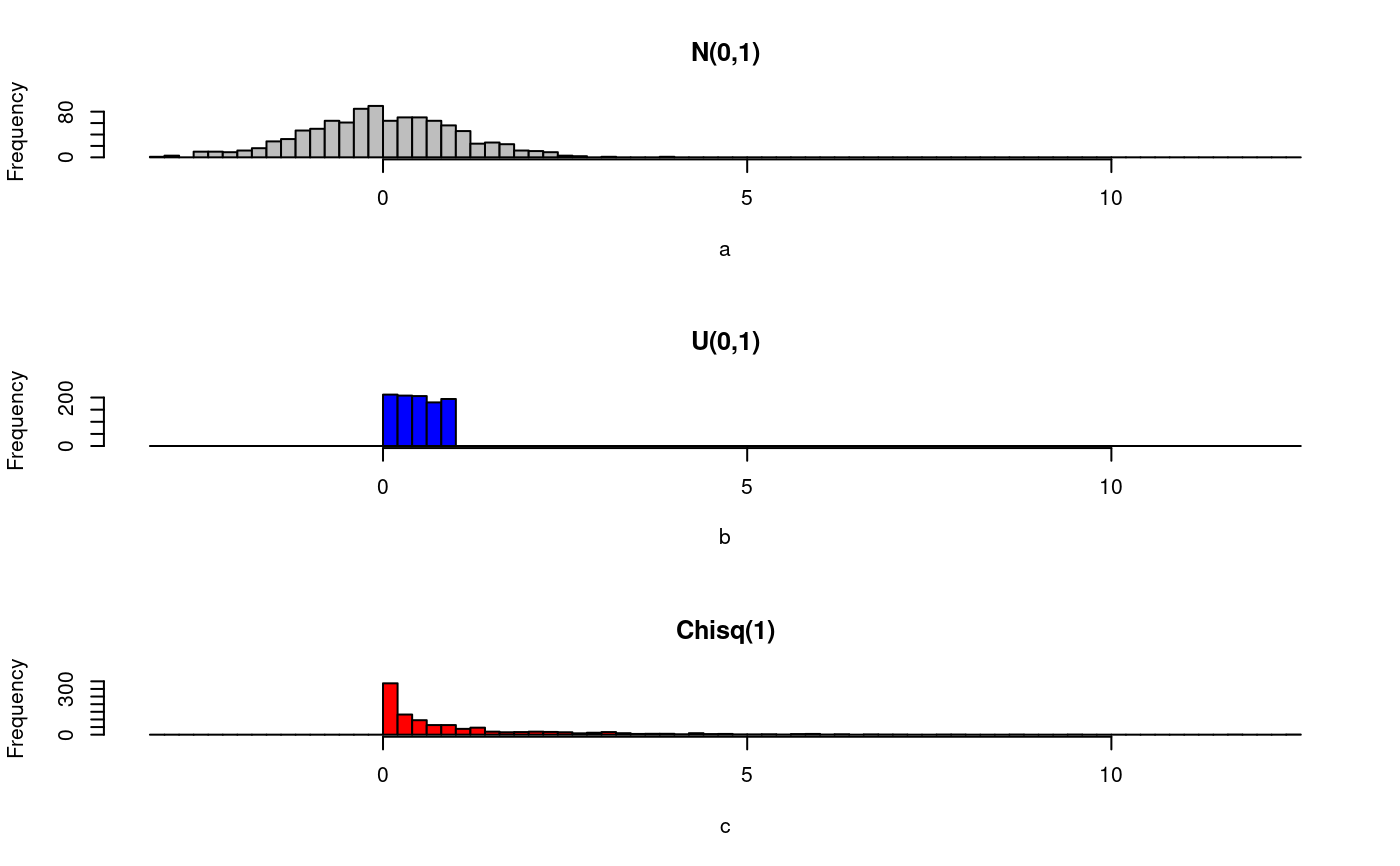
Examples
# two aligned histograms with the same 'ylim' showing the relative # proportions histv(seq(1,10), seq(1,20,.1), ylimFixed=TRUE)set.seed(1) n <- 1000 a <- rnorm(n) b <- runif(n) c <- rchisq(n,1) histv(a, b, c, breaks = 100, main = c('N(0,1)', 'U(0,1)', 'Chisq(1)'), col = c('gray','blue','red'))