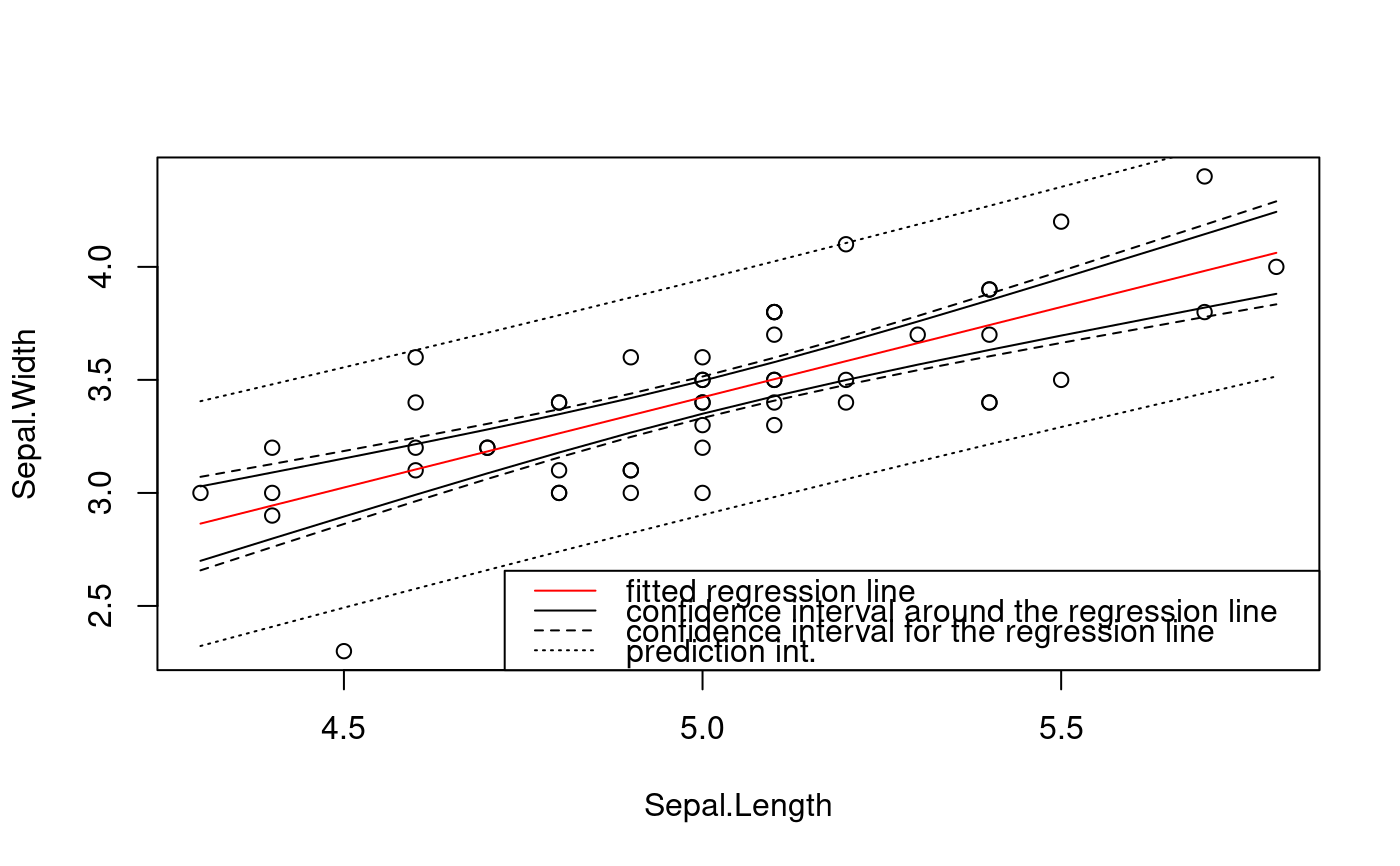
Confidence and prediction intervals for regression.
lmInt.RdlmInt contructs confidence and prediction intervals for
linear regression. It computes confidence intervals around the regression
line (i.e. the point-wise confidence bands of \(E(Y | X = x)\)
for each individual \(x\)), confidence intervals for the
regression line (i.e. the simultaneous confidence bands of
\(E(Y)\) for all \(x\)), and prediction intervals (i.e.
point-wise confidence bands for new observations \(Y\) for each
individual \(x\)).
lmInt(m, newdata = NULL, level = 0.95)
Arguments
| m | a fitted linear model |
|---|---|
| newdata | a data frame to look for predictors. If omitted,
fitted values will be used. If a single numeric and if the model
specifies a single predictor only, a new data frame will get
generated by taking |
| level | confidence level |
Details
The confidence intervals around the regression line and the
prediction intervals are computed using the
predict.lm function.
The confidence intervals for the regression line are computed
according to eq. (4.15) in Zvara2008.
Value
An object of class lmInt - a data frame consisting of the model
matrix followed by columns of the:
fit holding the mean value fitted by the regression model,
ciaLwr and ciaUpr holding confidence intervals
around the regression line,
cifLwr and cifUpr holding confidence intervals
for the regression line, and
piLwr and piUpr holding predictions intervals.
References
Karel Zv\'ara: Regrese, Matfyzpress Praha 2008
See also
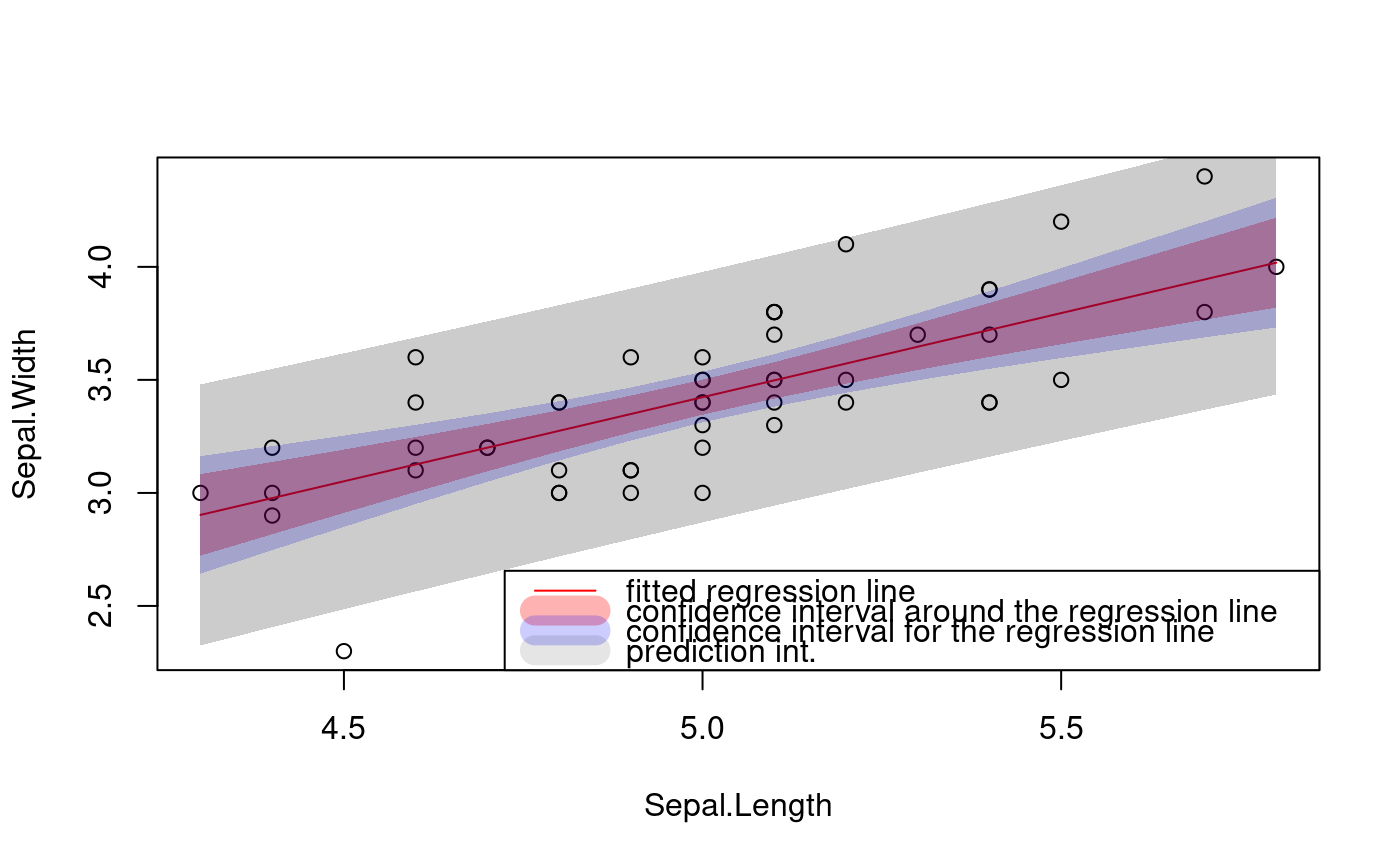
Examples
iris.setosa<-iris[iris$Species=='setosa',] attach(iris.setosa) # simple line fitting (one predictor only) m <- lm(Sepal.Width ~ Sepal.Length) lmi <- lmInt(m)#> Warning: predictions on current data refer to _future_ responseslegend('bottomright', bg='white', c('fitted regression line', 'confidence interval around the regression line', 'confidence interval for the regression line', 'prediction int.'), col = c('red', 'black', 'black', 'black'), lty = c(1, 1, 2, 3))# using more predictors m2 <- lm(Sepal.Width ~ Sepal.Length + Petal.Length + offset(Petal.Width)) lmi2 <- lmInt(m2, newdata = data.frame( Sepal.Length = Sepal.Length, Petal.Length = mean(Petal.Length), Petal.Width = mean(Petal.Width))) plot(Sepal.Length, Sepal.Width)legend('bottomright', bg='white', c('fitted regression line', 'confidence interval around the regression line', 'confidence interval for the regression line', 'prediction int.'), col = c('red', scales::alpha('red',.3), scales::alpha('blue',.2), scales::alpha('black',.1)), lty = 1, lwd = c(1, 15, 15, 15))detach(iris.setosa)