Plot a matrix.
plotMatrix.Rd'plotMatrix' plots a matrix, decorated with the names of rows and columns, and, if requested, with lines separating specified rows/columns. Also, a legend gets drawn, by default.
plotMatrix(x, col = gray.colors(16), transpose = FALSE, axes = c(2,
    3), legend = TRUE, legend.width = 0.2, legend.nlevels = length(col) +
    1, rowDelim = NULL, rowDelimCol = "black", colDelim = NULL,
    colDelimCol = "black")
Arguments
| x | a matrix |
|---|---|
| col | colors |
| transpose | transpose the matrix? |
| axes | which axes (sides of the matrix) to annotate? (1=below, 2=left, 3=above and 4=right). |
| legend | draw legend? |
| legend.width | the relative width of the legend to the total width of the plot |
| legend.nlevels | number of levels in the legend (defaults to the number of colors in 'col') |
| rowDelim | an optional vector of rows after which to put a separation line |
| rowDelimCol | the color of the row separation line |
| colDelim | an optional vector of columns after which to put a separation line |
| colDelimCol | the color of the column separation line |
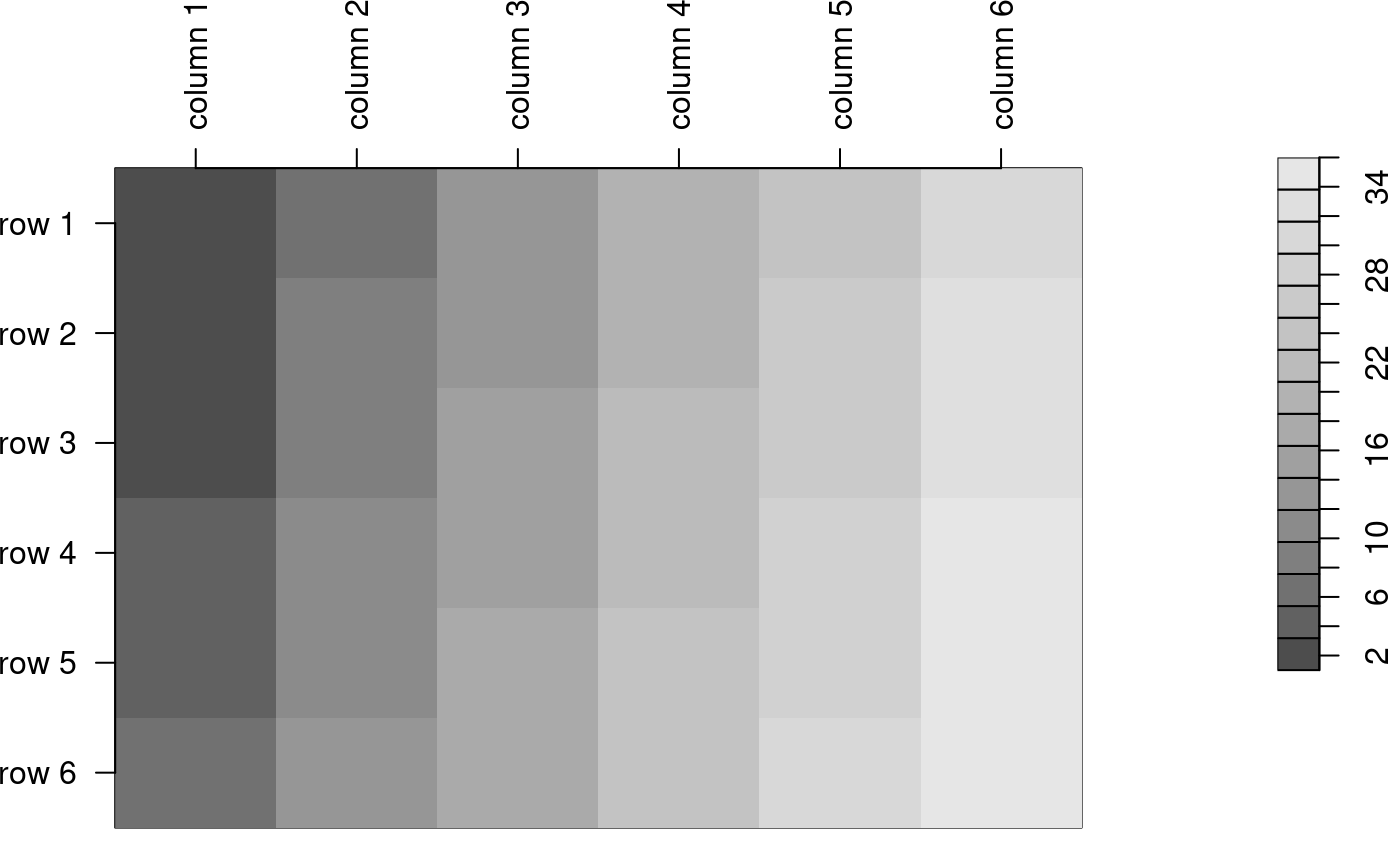
Examples
#> column 1 column 2 column 3 column 4 column 5 column 6 #> row 1 1 7 13 19 25 31 #> row 2 2 8 14 20 26 32 #> row 3 3 9 15 21 27 33 #> row 4 4 10 16 22 28 34 #> row 5 5 11 17 23 29 35 #> row 6 6 12 18 24 30 36plotMatrix(x)# group rows and columns x<-repmat(matrix(3-c(1,2,1,2,3,2,1,2,1),3),3,3) plotMatrix(x, rowDelim = c(3,6), colDelim = c(3,6), colDelimCol='red')