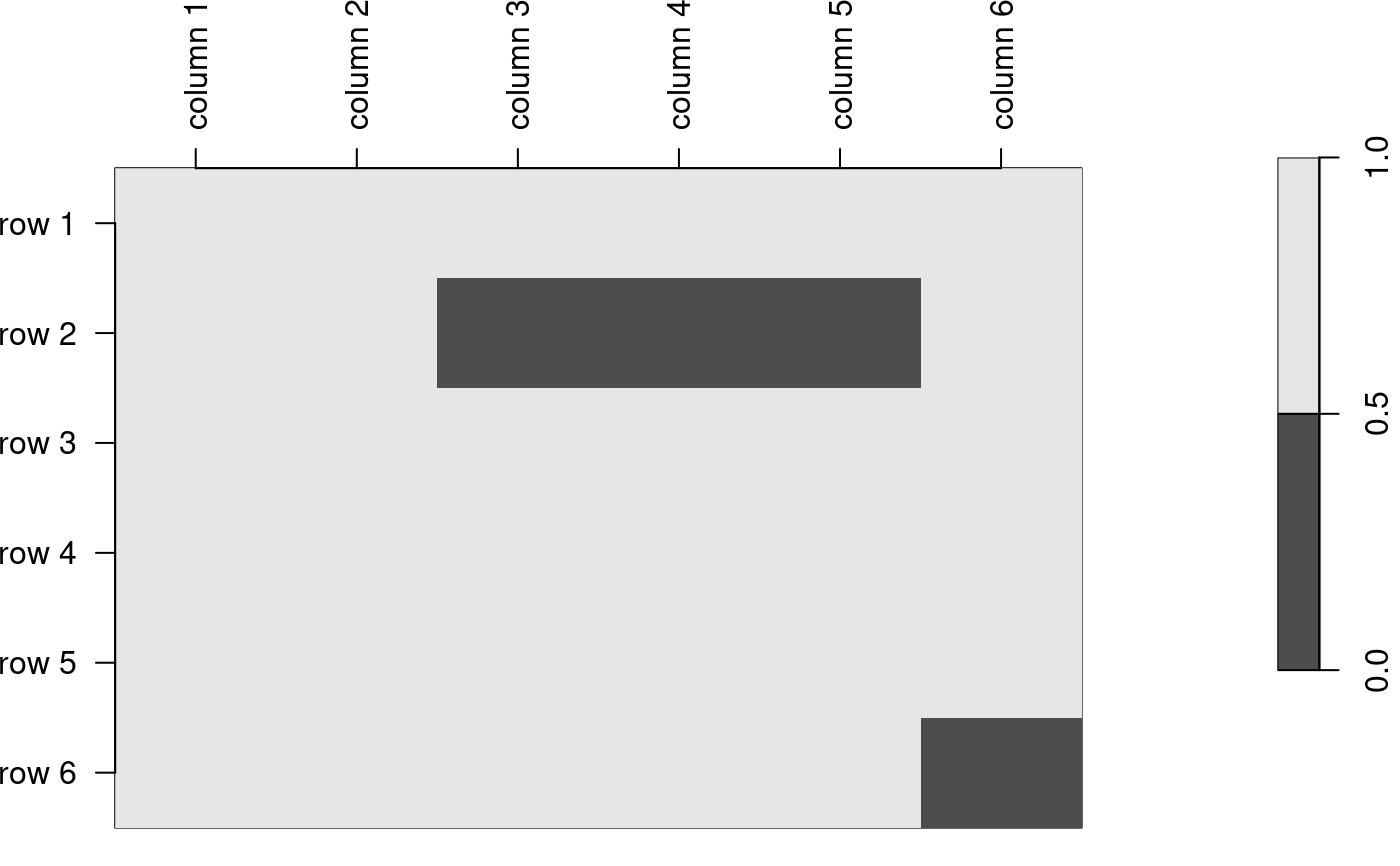
Plot a shadow matrix.
plotShadow.RdplotShadow explores missing values in a matrix by
plotting the shadow matrix of the data, in which missing values
are coded as black rectangles, and non-missing values are given
in light gray.
plotShadow(x, col = gray.colors(2), transpose = FALSE)
Arguments
| x | a matrix |
|---|---|
| col | color palette |
| transpose | transpose the matrix? |
Examples
x<-matrix(1:36,6)
rownames(x)<-paste('row',1:6)
colnames(x)<-paste('column',1:6)
x[2,3:5]<-NA
x[6,6]<-NA
x#>       column 1 column 2 column 3 column 4 column 5 column 6
#> row 1        1        7       13       19       25       31
#> row 2        2        8       NA       NA       NA       32
#> row 3        3        9       15       21       27       33
#> row 4        4       10       16       22       28       34
#> row 5        5       11       17       23       29       35
#> row 6        6       12       18       24       30       NAplotShadow(x)
