Calibration in regression.
lmCalib.RdlmCalib computes the estimate of \(x_0\) in which the regression
of \(y ~ x\) reaches given \(y0\), and the related confidence interval.
lmCalib(x, y, y0, fixed = FALSE, approx = FALSE, alpha = 0.05)
Arguments
| x | independent variable |
|---|---|
| y | dependent variable |
| y0 | dependent variable for which to compute the expected independent variable |
| fixed | is |
| approx | use approximation, or Fieller method? |
| alpha | confidence interval significance level |
Details
The code is taken from Appendix A.4.5 in Zvara2008. The estimation is based on chapter 4.4. in Zvara2008
Value
A vector of the estimate of 'x0', and lower and upper limits of related confidence interval.
References
Karel Zv\'ara: Regrese, Matfyzpress Praha 2008, J.A. Neter, W. Wasserman, M. Kutner: Applied Linear Statistical Models, Irwin, Homewood, Illinois (1985).
See also
Examples
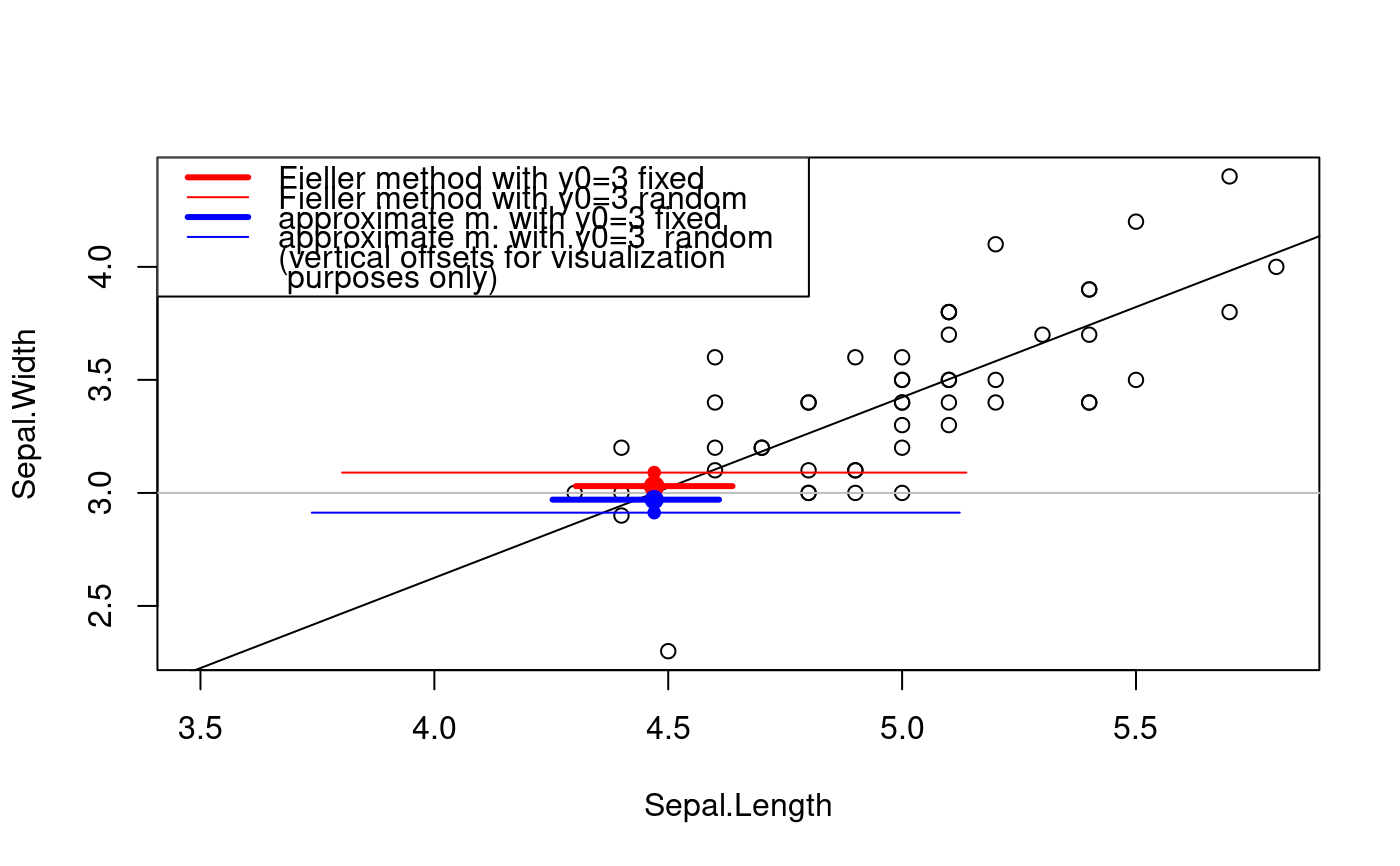
iris.setosa<-iris[iris$Species=='setosa',] attach(iris.setosa) plot(Sepal.Length, Sepal.Width, xlim=c(min(3.5,min(Sepal.Length)),max(Sepal.Length)))# Fieller method with y0 fixed calib <- lmCalib(Sepal.Length, Sepal.Width, y0, fixed = TRUE, approx = TRUE) lines(calib[2:3],rep(y0,2)*1.01,col='red',lwd=3)# Fieller method with y0 random calib <- lmCalib(Sepal.Length, Sepal.Width, y0, fixed = FALSE, approx = TRUE) lines(calib[2:3],rep(y0,2)*1.03,col='red',lwd=1)# approximate method with y0 fixed calib <- lmCalib(Sepal.Length, Sepal.Width, y0, fixed = TRUE, approx = FALSE) lines(calib[2:3],rep(y0,2)/1.01,lwd=3,col='blue')# approximate method with y0 random calib <- lmCalib(Sepal.Length, Sepal.Width, y0, fixed = FALSE, approx = FALSE) lines(calib[2:3],rep(y0,2)/1.03,lwd=1,col='blue')legend('topleft', bg='white', c(paste0('Fieller method with y0=',y0,' fixed'), paste0('Fieller method with y0=',y0,' random'), paste0('approximate m. with y0=',y0,' fixed'), paste0('approximate m. with y0=',y0,' random'), '(vertical offsets for visualization', ' purposes only)'), col = c('red', 'red', 'blue', 'blue', 'black'), lwd = c(3, 1, 3, 1, NA, NA))detach(iris.setosa)